What makes prices rise and fall? Do candymakers have a meeting and decide how much they will charge for their candy? Or does the government command candymakers to lower their prices? Who actually determines the prices of the stuff we buy? It might seem like mysterious forces are at work, but that's not the case.
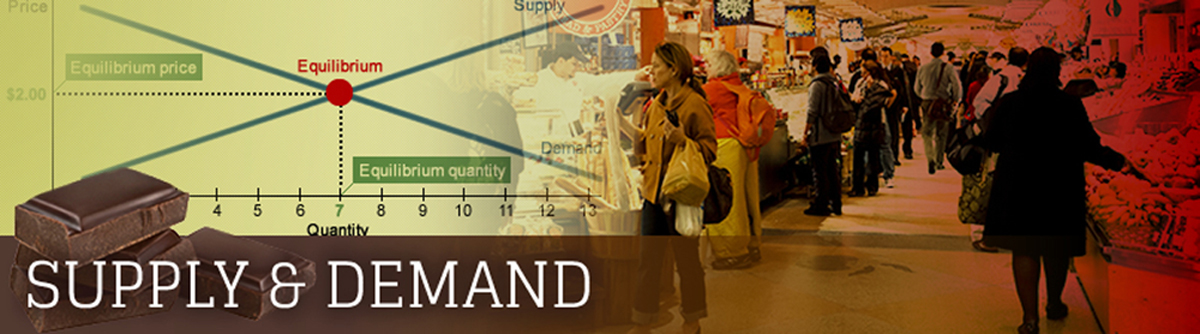
Prices for most goods and services are determined in markets by what economists call supply and demand. This module will use a fictitious chocolate market to help you better understand how supply and demand work together to determine prices.
In fact, supply and demand are among the most fundamental concepts in economics, so being familiar with these terms will help you better understand the economic world around you one chocolate bar at a time.
